Introduction
A developer gets paged. Checkout is throwing errors. They open the internal developer platform they deployed through, click into logs, and the platform hands back pod names, namespaces and container IDs. Nothing in that view mentions the checkout component they shipped last week, or the project it belongs to. So they leave the IDP, open a terminal, and start listing pods.
That is the moment an IDP stops earning its keep. The platform abstracted away Deployments, Services and namespaces at deploy time, then handed every one of them back at debug time.
Log collection is not what breaks here. Fluent Bit settled that question years ago: platform teams deploy it as a DaemonSet, it collects from every container, it routes to a backend. The gap is semantic. A raw log line carries no notion of a component, a project, or an environment, so the platform has nothing to join on when a developer asks a question in the platform’s own vocabulary.
OpenChoreo, an open source CNCF sandbox IDP for Kubernetes, closes that gap at collection time rather than at query time. It ships observability as part of the platform instead of asking teams to wire up a separate stack, and it surfaces logs, metrics, traces and events through OpenChoreo concepts rather than raw Kubernetes primitives.
This article walks through how OpenChoreo does that for one signal – logs, using Fluent Bit.
Controlling logs at the source
Most platform teams treat log collection as plumbing: get the lines off the node, into the backend, and it’s done. It’s the least interesting box on the architecture diagram, and it gets the least thought.
That’s backwards, and Fluent Bit shows us why.
Ask a platform team how they collect logs on a Kubernetes cluster, and you’ll get the same answer often enough that it has stopped being a decision and become a default. There are good reasons for that. Fluent Bit was designed as a low resource, high throughput, and highly scalable solution for cloud native environments. It runs as a DaemonSet on every node without eating the budget we’d rather spend on workloads. As a CNCF graduated project it has an active community and an issue tracker with real people in it instead of a support portal.
But none of that is the real reason it matters for platform engineering.
Fluent Bit sits at the path of every log line on every node, before that line goes anywhere else. That position, in front of the data not behind it, means we can parse it, filter it, route it, and rewrite each record before it reaches the backend. We decide what a log record looks like by the time it reaches the backend, not the application teams, and not whoever wrote the container image.
That’s fundamentally a different position to be in. Once we control the shape of the record at the source, we can make our logs answer to something other than Kubernetes, which is exactly what OpenChoreo does next.
Mapping container logs to OpenChoreo through enrichment
OpenChoreo runs on a multi-plane architecture. It has a control plane, a data plane, a workflow plane and an observability plane. Each plane has its own job. The job of the observability plane, as its name suggests, powers observability features. Once the core observability features are installed, platform engineers need to deploy a logs module to enable logging.
OpenChoreo supports several logs modules, including ones based on OpenSearch and OpenObserve. Installing these logs modules deploys a Fluent Bit daemonset for log collection with a predefined data pipeline.
Here’s how a log line gets there. In Kubernetes, containers write logs to the container’s standard output (stdout) and standard error (stderr), and the container runtime captures the output and stores it on the node. Fluent Bit’s tail input plugin watches the logs path and picks up new log lines as they’re written. These logs traverse through the Fluent Bit data pipeline and are sent to either OpenSearch or OpenObserve through the opensearch or http output plugins respectively.
A raw log line on its own doesn’t mean much inside an IDP. So how do we shape the log entries the way we want? We use a Kubernetes filter in the pipeline to enrich our raw log entries with Kubernetes metadata. With this filter, logs emitted by a given container will be enriched by that pod’s name, namespace, labels etc. Some of the labels added are OpenChoreo labels. OpenChoreo adds pod labels to identify which workload the pod belongs to. To understand what each of these labels mean, we need to look at a few OpenChoreo concepts.
OpenChoreo organizes workloads around namespaces, projects and components. A component is a single deployable piece of software. A project is a collection of related components and a project can be scoped to a namespace or to the whole cluster.
Before a component can be deployed in OpenChoreo, a ComponentRelease is created. It is a
snapshot of the component’s configurations. Then a releaseBinding is created. A
releaseBinding is a ComponentRelease specific to a given environment. Finally,
Kubernetes artifacts such as Deployment and Service are generated, and the component
starts executing.
When this deployment creates a pod, OpenChoreo attaches a set of identifying labels, each
prefixed with openchoreo.dev. These come in pairs; a name label and its corresponding
UID label.
Let’s look at an example. The following image shows the labels in a pod running in an OpenChoreo deployment. This is a microservice from the GCP Microservices demo. As per the label, this pod belongs to the checkout component and is in the development environment.
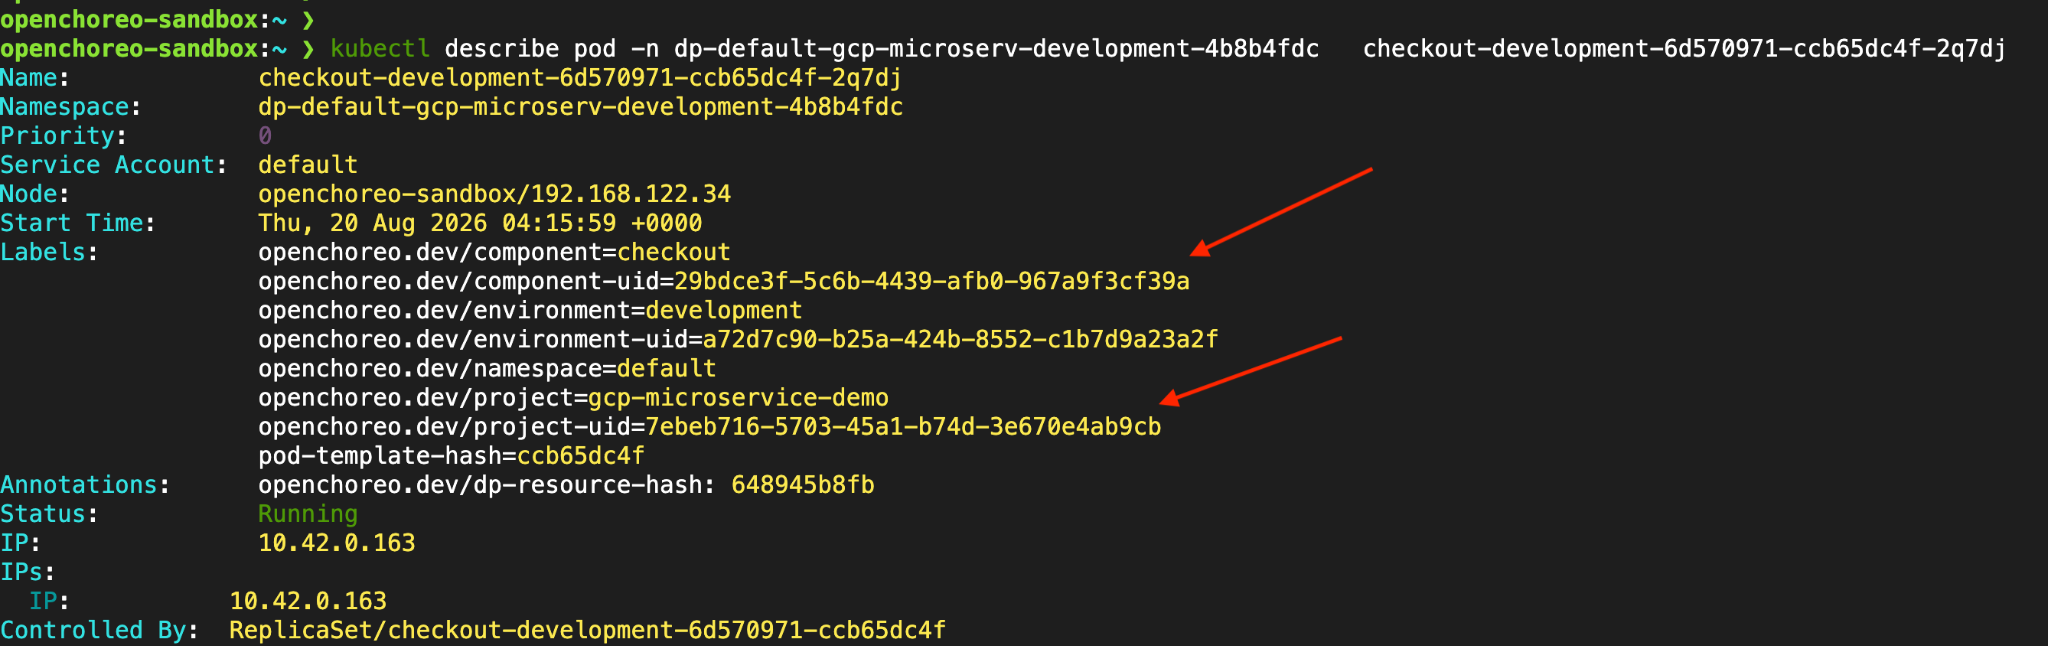 Figure 1 - OpenChoreo labels in a Kubernetes pod
Where do these names and UIDs come from? They’re not OpenChoreo-specific identifiers layered on top of Kubernetes. They are the underlying Kubernetes object names and UIDs.
While OpenChoreo provides several abstractions over Kubernetes, it does not hide the Kubernetes layer underneath. All OpenChoreo objects – namespaces, projects, components etc. are Kubernetes objects themselves. Users can access these objects directly as shown in the images below.
Figures 2 and 3 show the kubectl describe output for the gcp-microservice-demo project
and the checkout component in it. If you look at the UIDs in these objects, you will see
that it’s the same set of UIDs that we saw in the pod labels above.
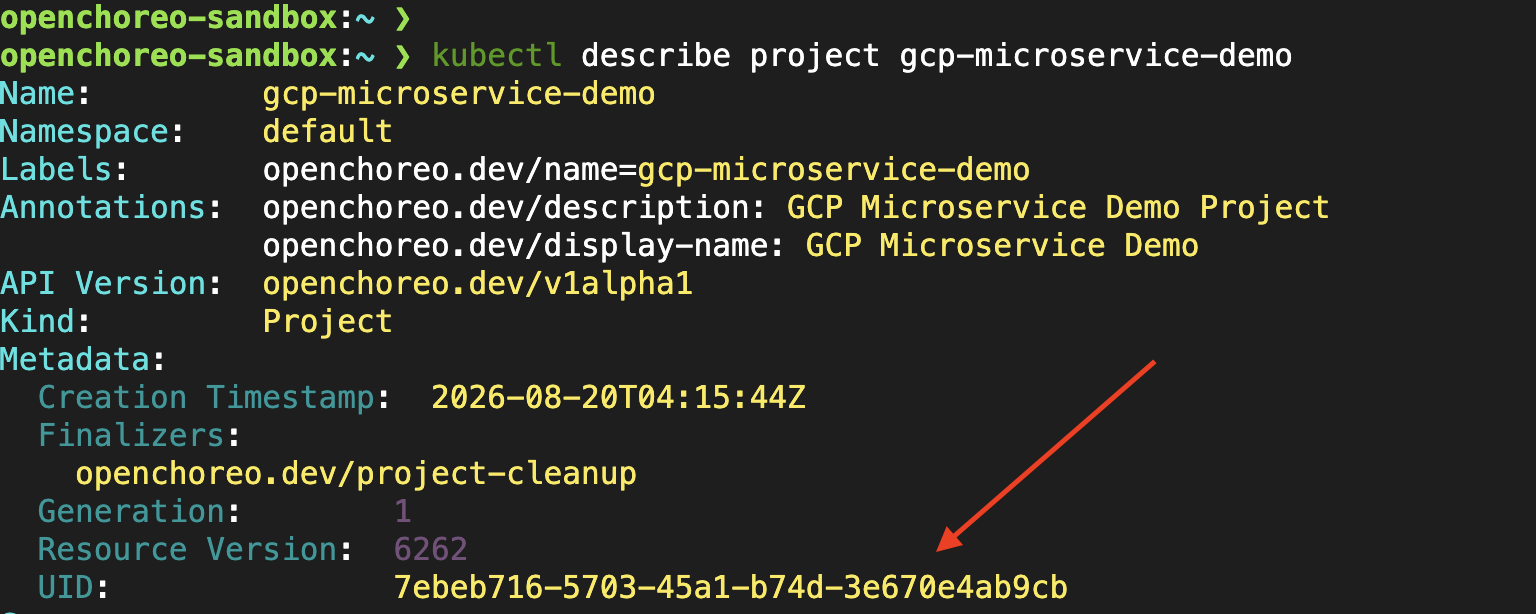 Figure 2 - OpenChoreo project UID
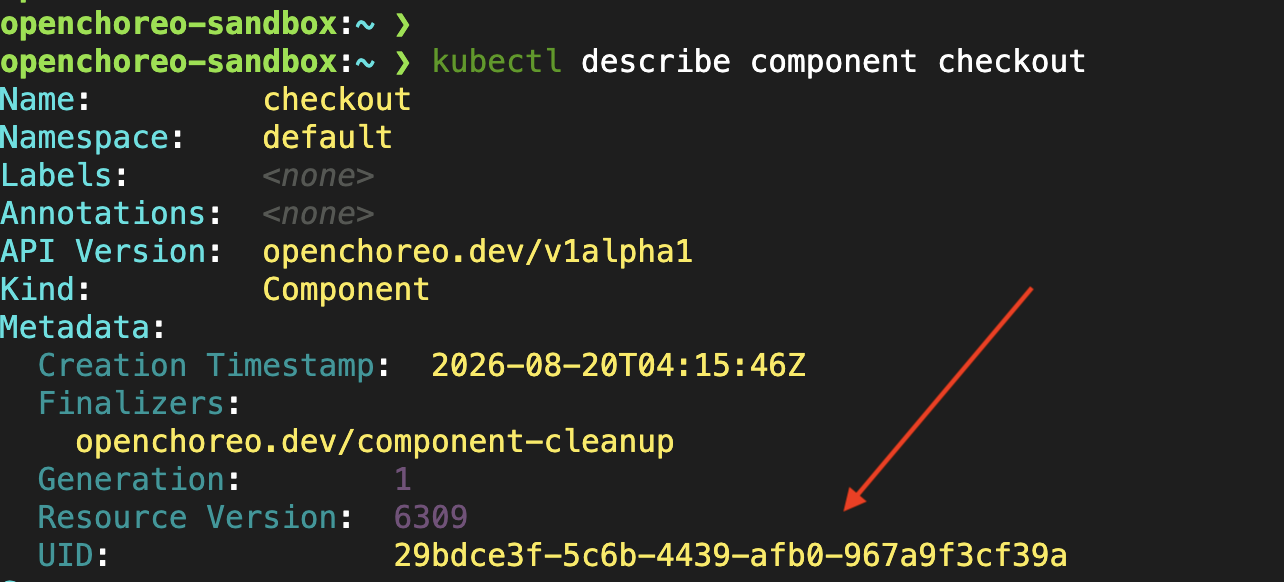 Figure 3 - OpenChoreo component UID
Back to where we stopped in the logs pipeline. Due to the Kubernetes filter in Fluent Bit, we now have a log entry enriched with metadata. This means it is complete with information about its relationship to OpenChoreo entities. Thereafter mapping them to an OpenChoreo component or a project is as easy as querying by the UIDs.
There is a reason log adapters query by UID when fetching logs. In Kubernetes, object names can be reused after the original object is deleted. If OpenChoreo queried by name instead, a reused name would pull in logs from a completely different, earlier instance of that entity. Querying by UID avoids that ambiguity entirely.
Conclusion
An Internal Developer Platform exists to reduce the friction of the software development process. That means a developer using one should see observability data mapped back to IDP entities such as components and projects instead of having to comb through raw Kubernetes logs.
In OpenChoreo, several logs modules use Fluent Bit for log collection. Its pipeline enriches raw logs with OpenChoreo metadata at collection time, and that metadata is what lets the platform trace logs back to the right component or project when a developer goes looking for them.
This is just one piece of how OpenChoreo makes observability in an IDP easier. Learn more about OpenChoreo’s observability features here.