Kubernetes in Production
More people use Kubernetes in production today as you can find more from the CNCF survey conducted earlier 2020.
- The use of containers in production has increased to 92%, up from 84% last year, and up 300% from our first survey in 2016.
- Kubernetes use in production has increased to 83%, up from 78% last year.
- 55% of respondents use stateful applications in containers in production.
Monitoring - Tracing, Time Series & Logging
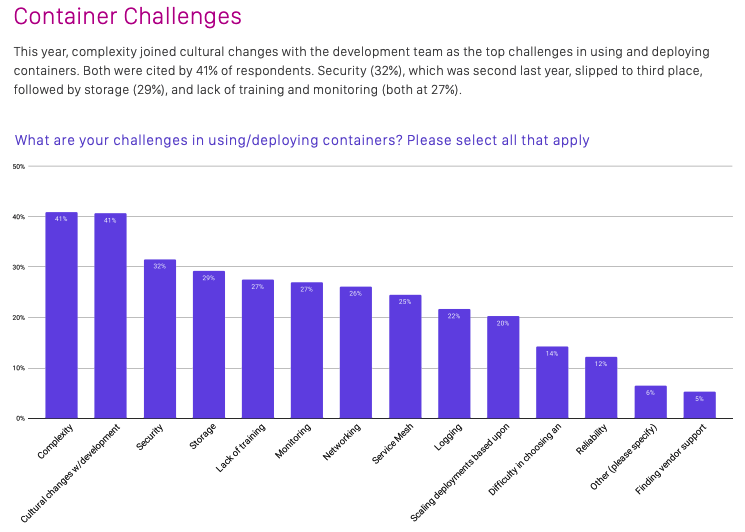
People talk more about “monitoring” by the context of tracing like distributed tracing from the application perspective as well as monitoring time series data technologies. However, the fundamental piece of of application and infrastructure is “logging” and this comes to a different story when you transform from traditional bare metal and VM based system’s architecture. This is also captured in the CNCF survey and 22% of responders answered “logging” is a challenge in using/deploying containers.
From: CNCF Survey 2020
Logging Challenges
For stable operation of Kubernetes, you need to capture events happening in running applications by gathering log information from all applications. Since applications running on Kubernetes are based on Docker containers, there are considerations for logging :
- Log information is stored locally in the host OS without associated Kubernetes metadata, such as namespace, pod name and label name.
- Log information is deleted when containers are terminated. Kubernetes itself delivers native functionality to capture log messages by performing “kubectl logs” commands but it does not work in highly scaled and distributed environments. That’s where Fluentd comes in. Fluentd helps you to centralize log information of running applications with Kubernetes metadata and route the information to desired destinations such as ElasticSearch or AWS S3. In this post, I will share how Fluentd works with example Kubernetes and EFK(ElasticSearch/Fluentd/Kibana) stack configuration.
You can learn more about logging concept of Kubernetes in Logging Architecture.
How Fluentd works with Kubernetes
Fluentd provides “Fluentd DaemonSet“ which enables you to collect log information from containerized applications easily. With DaemonSet, you can ensure that all (or some) nodes run a copy of a pod. Fluentd provides “fluent-plugin-kubernetes_metadata_filter” plugins which enriches pod log information by adding records with Kubernetes metadata. With that, you can identify where log information comes from and filter information easily with tagged records. You can learn more about Fluentd DaemonSet in Fluentd Doc - Kubernetes. “Fluentd DaemonSet“ also delivers pre-configured container images for major logging backend such as ElasticSearch, Kafka and AWS S3. You can find available Fluentd DaemonSet container images and sample configuration files for deployment in Fluentd DaemonSet for Kubernetes.
Logging with EFK Stack
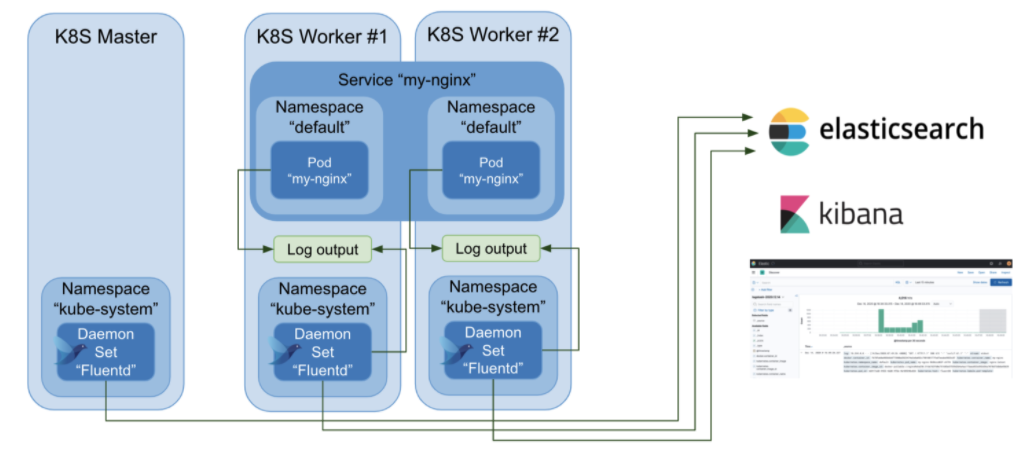
Let’s see how Fluentd works in Kubernetes in example use case with EFK stack. In this example, I deployed nginx pods and services and reviewed how log messages are treated by Fluentd and visualized using ElasticSearch and Kibana. With this example, you can learn Fluentd behavior in Kubernetes logging and how to get started. Overview of example use case is described in following image.
In this post, I use external ElasticSearch and Kibana with SSL enabled configuration.
Deploying nginx pods and services
I deployed nginx pods and services with steps described in Connecting Applications with Services.
- Create “my-nginx” pods with replications. ``` [admin@k8s-master01 service]$ vim run-my-nginx.yaml apiVersion: apps/v1 kind: Deployment metadata: name: my-nginx spec: selector: matchLabels: run: my-nginx replicas: 2 template: metadata: labels: run: my-nginx spec: containers: - name: my-nginx image: nginx ports: - containerPort: 80
[admin@k8s-master01 service]$ kubectl apply -f run-my-nginx.yaml deployment.apps/my-nginx created
2. Create “my-nginx“ service.
[admin@k8s-master01 service]$ cat nginx-svc.yaml apiVersion: v1 kind: Service metadata: name: my-nginx labels: run: my-nginx spec: ports: - port: 80 protocol: TCP selector: run: my-nginx
[admin@k8s-master01 service]$ kubectl apply -f nginx-svc.yaml service/my-nginx created
3. Get endpoints of “my-nginx” service.
[admin@k8s-master01 service]$ kubectl get ep my-nginx NAME ENDPOINTS AGE my-nginx 10.244.1.22:80,10.244.2.16:80 4m19s
4. Perform HTTP request to “my-nginx“ endpoints and you can check access log information in “kubectl logs“ output.
Kubertentes metadata, such as namespace and container images, is not included in “kubectl logs“ output.
[admin@k8s-master01 service]$ curl 10.244.1.22:80
[root@k8s-master01 ~]# kubectl logs –follow my-nginx-5b56ccd65f- 10.244.0.0 - - [16/Dec/2020:10:19:52 +0000] “GET / HTTP/1.1” 200 612 “-“ “curl/7.61.1” “-“
You can also find log information under “/var/log/pods/{pod name}“directories in host.
[root@fluent02 ~]# tail /var/log/pods/default_my-nginx-5b56ccd65f-s6xxg_208eb6c7-71ec-443a-8d16-20185886c8ea/my-nginx/0.log {“log”:”10.244.0.0 - - [16/Dec/2020:10:19:52 +0000] “GET / HTTP/1.1” 200 612 “-” “curl/7.61.1” “-"\n”,”stream”:”stdout”,”time”:”2020-12-16T10:19:52.615310008Z”}
## Deploying Fluentd DaemonSet
1. Clone Git repository of Fluentd DaemonSet.
[admin@k8s-master01 fluent]$ git clone https://github.com/fluent/fluentd-kubernetes-daemonset
2. Create “ServiceAccount” and “ClusterRole” for Fluentd DaemonSet.
[admin@k8s-master01 fluent]$ vim fluent-account.yaml apiVersion: v1 kind: ServiceAccount metadata: name: fluentd namespace: kube-system
---

apiVersion: rbac.authorization.k8s.io/v1beta1
kind: ClusterRole
metadata:
    name: fluentd
    namespace: kube-system
rules:
- apiGroups:
    - ""
    resources:
    - pods
    - namespaces
    verbs:
    - get
    - list
    - watch

---

kind: ClusterRoleBinding
apiVersion: rbac.authorization.k8s.io/v1beta1
metadata:
    name: fluentd
roleRef:
    kind: ClusterRole
    name: fluentd
    apiGroup: rbac.authorization.k8s.io
subjects:
- kind: ServiceAccount
    name: fluentd
    namespace: kube-system
[admin@k8s-master01 fluent]$ kubectl apply -f fluent-account.yaml
- Create Fluentd DaemonSet with ElasticSearch configuration.
In this post, I use configuration of external ElasticSearch cluster.
FLUENT_ELASTICSEARCH_HOST : “elastic01.demo.local” FLUENT_ELASTICSEARCH_PORT : “9200“ FLUENT_ELASTICSEARCH_SCHEME : “https” FLUENT_ELASTICSEARCH_USER : elastic FLUENT_ELASTICSEARCH_PASSWORD : {password of user ‘elastic’} FLUENT_ELASTICSEARCH_LOGSTASH_PREFIX : {your custom prefix name, “fluentd.k8sdemo” for instance}
Also, I use following container images for ElasticSearch connection :
image : fluent/fluentd-kubernetes-daemonset:v1.11.5-debian-elasticsearch7-1.1
You can find available environment values in of “fluent/fluentd-kubernetes-daemonset:v1.11.5-debian-elasticsearch7-1.1” image in conf of v1.11.5-debian-elasticsearch7-1.1.
[admin@k8s-master01 fluent]$ cd fluentd-kubernetes-daemonset/
[admin@k8s-master01 fluentd-kubernetes-daemonset]$ vim fluentd-daemonset-elasticsearch.yaml
    apiVersion: apps/v1
    kind: DaemonSet
    metadata:
      name: fluentd
      namespace: kube-system
      labels:
          k8s-app: fluentd-logging
          version: v1
    spec:
        selector:
            matchLabels:
                k8s-app: fluentd-logging
                version: v1
        template:
            metadata:
                labels:
                    k8s-app: fluentd-logging
                    version: v1
            spec:
                serviceAccount: fluentd
                serviceAccountName: fluentd
                tolerations:
                - key: node-role.kubernetes.io/master
                    effect: NoSchedule
                containers:
                - name: fluentd
                    image: fluent/fluentd-kubernetes-daemonset:v1.11.5-debian-elasticsearch7-1.1
                    env:
                      - name: FLUENT_ELASTICSEARCH_HOST
                        value: "elastic01.demo.local"
                      - name: FLUENT_ELASTICSEARCH_PORT
                        value: "9200"
                      - name: FLUENT_ELASTICSEARCH_SCHEME
                        value: "https"
                      - name: FLUENTD_SYSTEMD_CONF
                        value: "disable"
                      - name: FLUENT_ELASTICSEARCH_SSL_VERIFY
                        value: "false"
                      - name: FLUENT_ELASTICSEARCH_USER
                        value: "elastic"
                      - name: FLUENT_ELASTICSEARCH_PASSWORD
                        value: {password of user 'elastic'}
                      - name: FLUENT_ELASTICSEARCH_LOGSTASH_FORMAT
                        value: "true"
                      - name: FLUENT_ELASTICSEARCH_LOGSTASH_PREFIX
                        value: "fluentd.k8sdemo"
                      - name: FLUENT_UID
                        value: "0"
                    resources:
                        limits:
                            memory: 200Mi
                        requests:
                            cpu: 100m
                            memory: 200Mi
                    volumeMounts:
                    - name: varlog
                       mountPath: /var/log
                    - name: varlibdockercontainers
                       mountPath: /var/lib/docker/containers
                       readOnly: true
                terminationGracePeriodSeconds: 30
                volumes:
                - name: varlog
                   hostPath:
                      path: /var/log
                - name: varlibdockercontainers
                   hostPath:
                      path: /var/lib/docker/containers
[admin@k8s-master01 fluentd-kubernetes-daemonset]$ kubectl apply -f fluentd-daemonset-elasticsearch.yaml
- Check status of Fluentd DaemonSet.
[admin@k8s-master01 fluentd-kubernetes-daemonset]$ kubectl get pods --namespace kube-system | grep fluentd
fluentd-7n5q2        1/1    Running     0    100s
fluentd-9m6x2       1/1    Running     0    89s
fluentd-ct5gd         1/1    Running     0    37s
You can check more details by “kubectl describe“ command for troubleshooting.
[admin@k8s-master01 fluentd-kubernetes-daemonset]$ kubectl describe pod fluentd-drtc8 --namespace kube-system
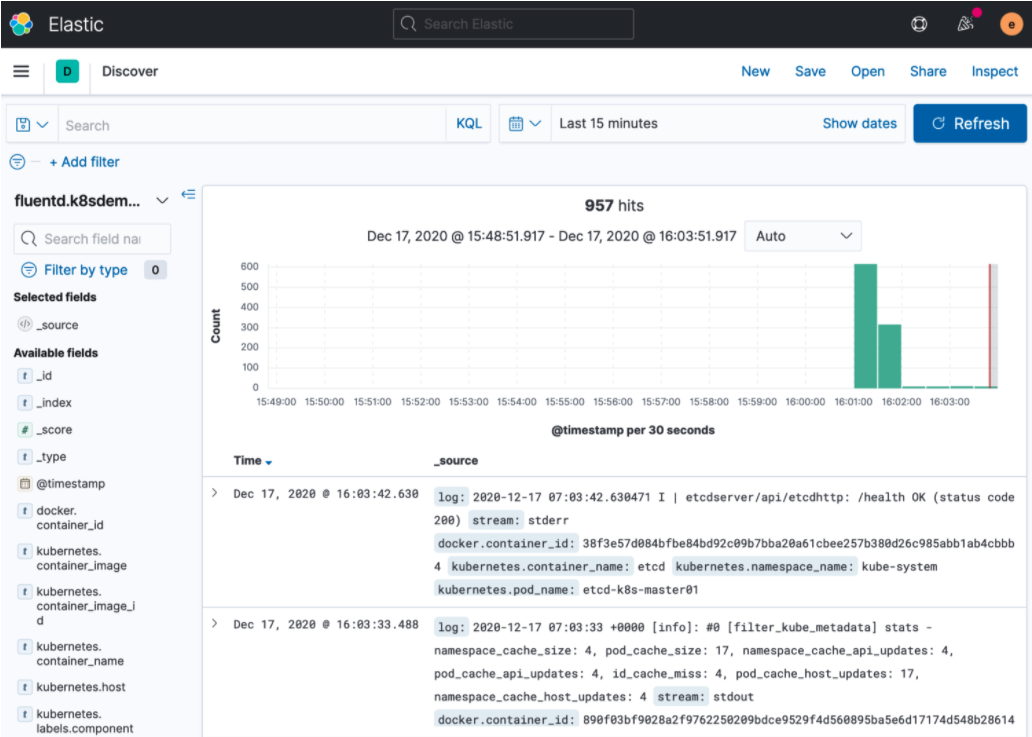
Checking messages in Kibana
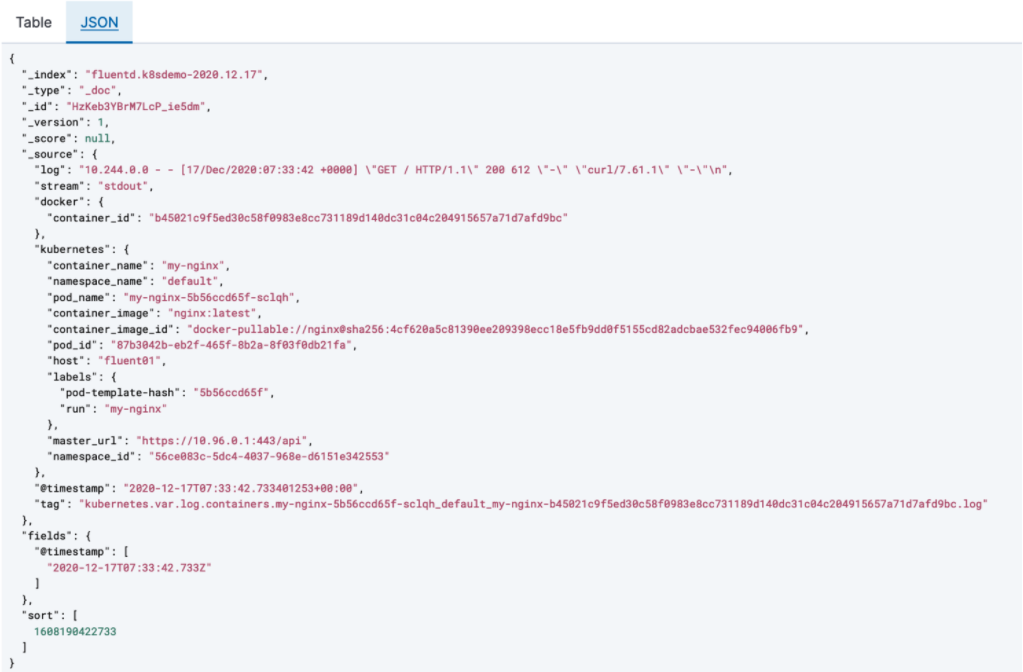
Once Fluentd DaemonSet become “Running“ status without errors, now you can review logging messages from Kubernetes cluster with Kibana dashboard. Logging messages are stored in “FLUENT_ELASTICSEARCH_LOGSTASH_PREFIX” index defined in DaemonSet configuration. In this post, I used “fluentd.k8sdemo” as prefix. Fluentd DaemonSet collect log information from “etcd” and “kube-controller-manager“ as well as custom application pods.
You can see Fluentd DaemonSet enriches log information with Kubernetes metadata.